For my “Labs” final project as a student in Lambda School’s data science program, I joined up with a working team and contributed to the real-world code base for a start-up called Story Squad.
All about Story Squad
Story Squad is a mission-driven start-up that gamifies empathy, anticipatory excitement, and creative expression, as an alternative to games that erode kids’ ability to focus by rewiring their dopamine pathways.
Many grown adults have lost hours, days, or weeks of life to clicker games that have more in common with Skinner boxes than they do with quality entertainment. It’s more worrying when children are targeted by these games, since they have less developed frontal lobes that might help them shake the game off if they’re not truly enjoying or benefiting from it.
Story Squad aspires to be one of many solutions to this problem of misaligned incentives between children and online game developers. What if kids could get that rush of competition and reward through creative expression, instead?
In Story Squad, kids read a given story at the beginning of each week. They then draw a scene from the story and handwrite a story of their own, based on a given prompt (e.g. “Describe the soccer tryouts from the perspective of {character}”). Photos of their written and drawn creations, essentially fanfiction and fanart (or, broadly, “fanworks”), are then uploaded to Story Squad.
Their art and writing is evaluated by multiple machine learning models so that the kids can be paired up with other kids of similar ability levels, for the purpose of competing with and against each other.
We have less than 4 weeks to do what now?
At the beginning of week 1, I had never heard of Story Squad. I had never dived deep into a website’s architecture map. I had never spoken with most of the people on my team. Story Squad has been a Lambda Labs project for many months now, so there was a large and complicated pre-existing code base that we all had to familiarize ourselves with VERY fast.
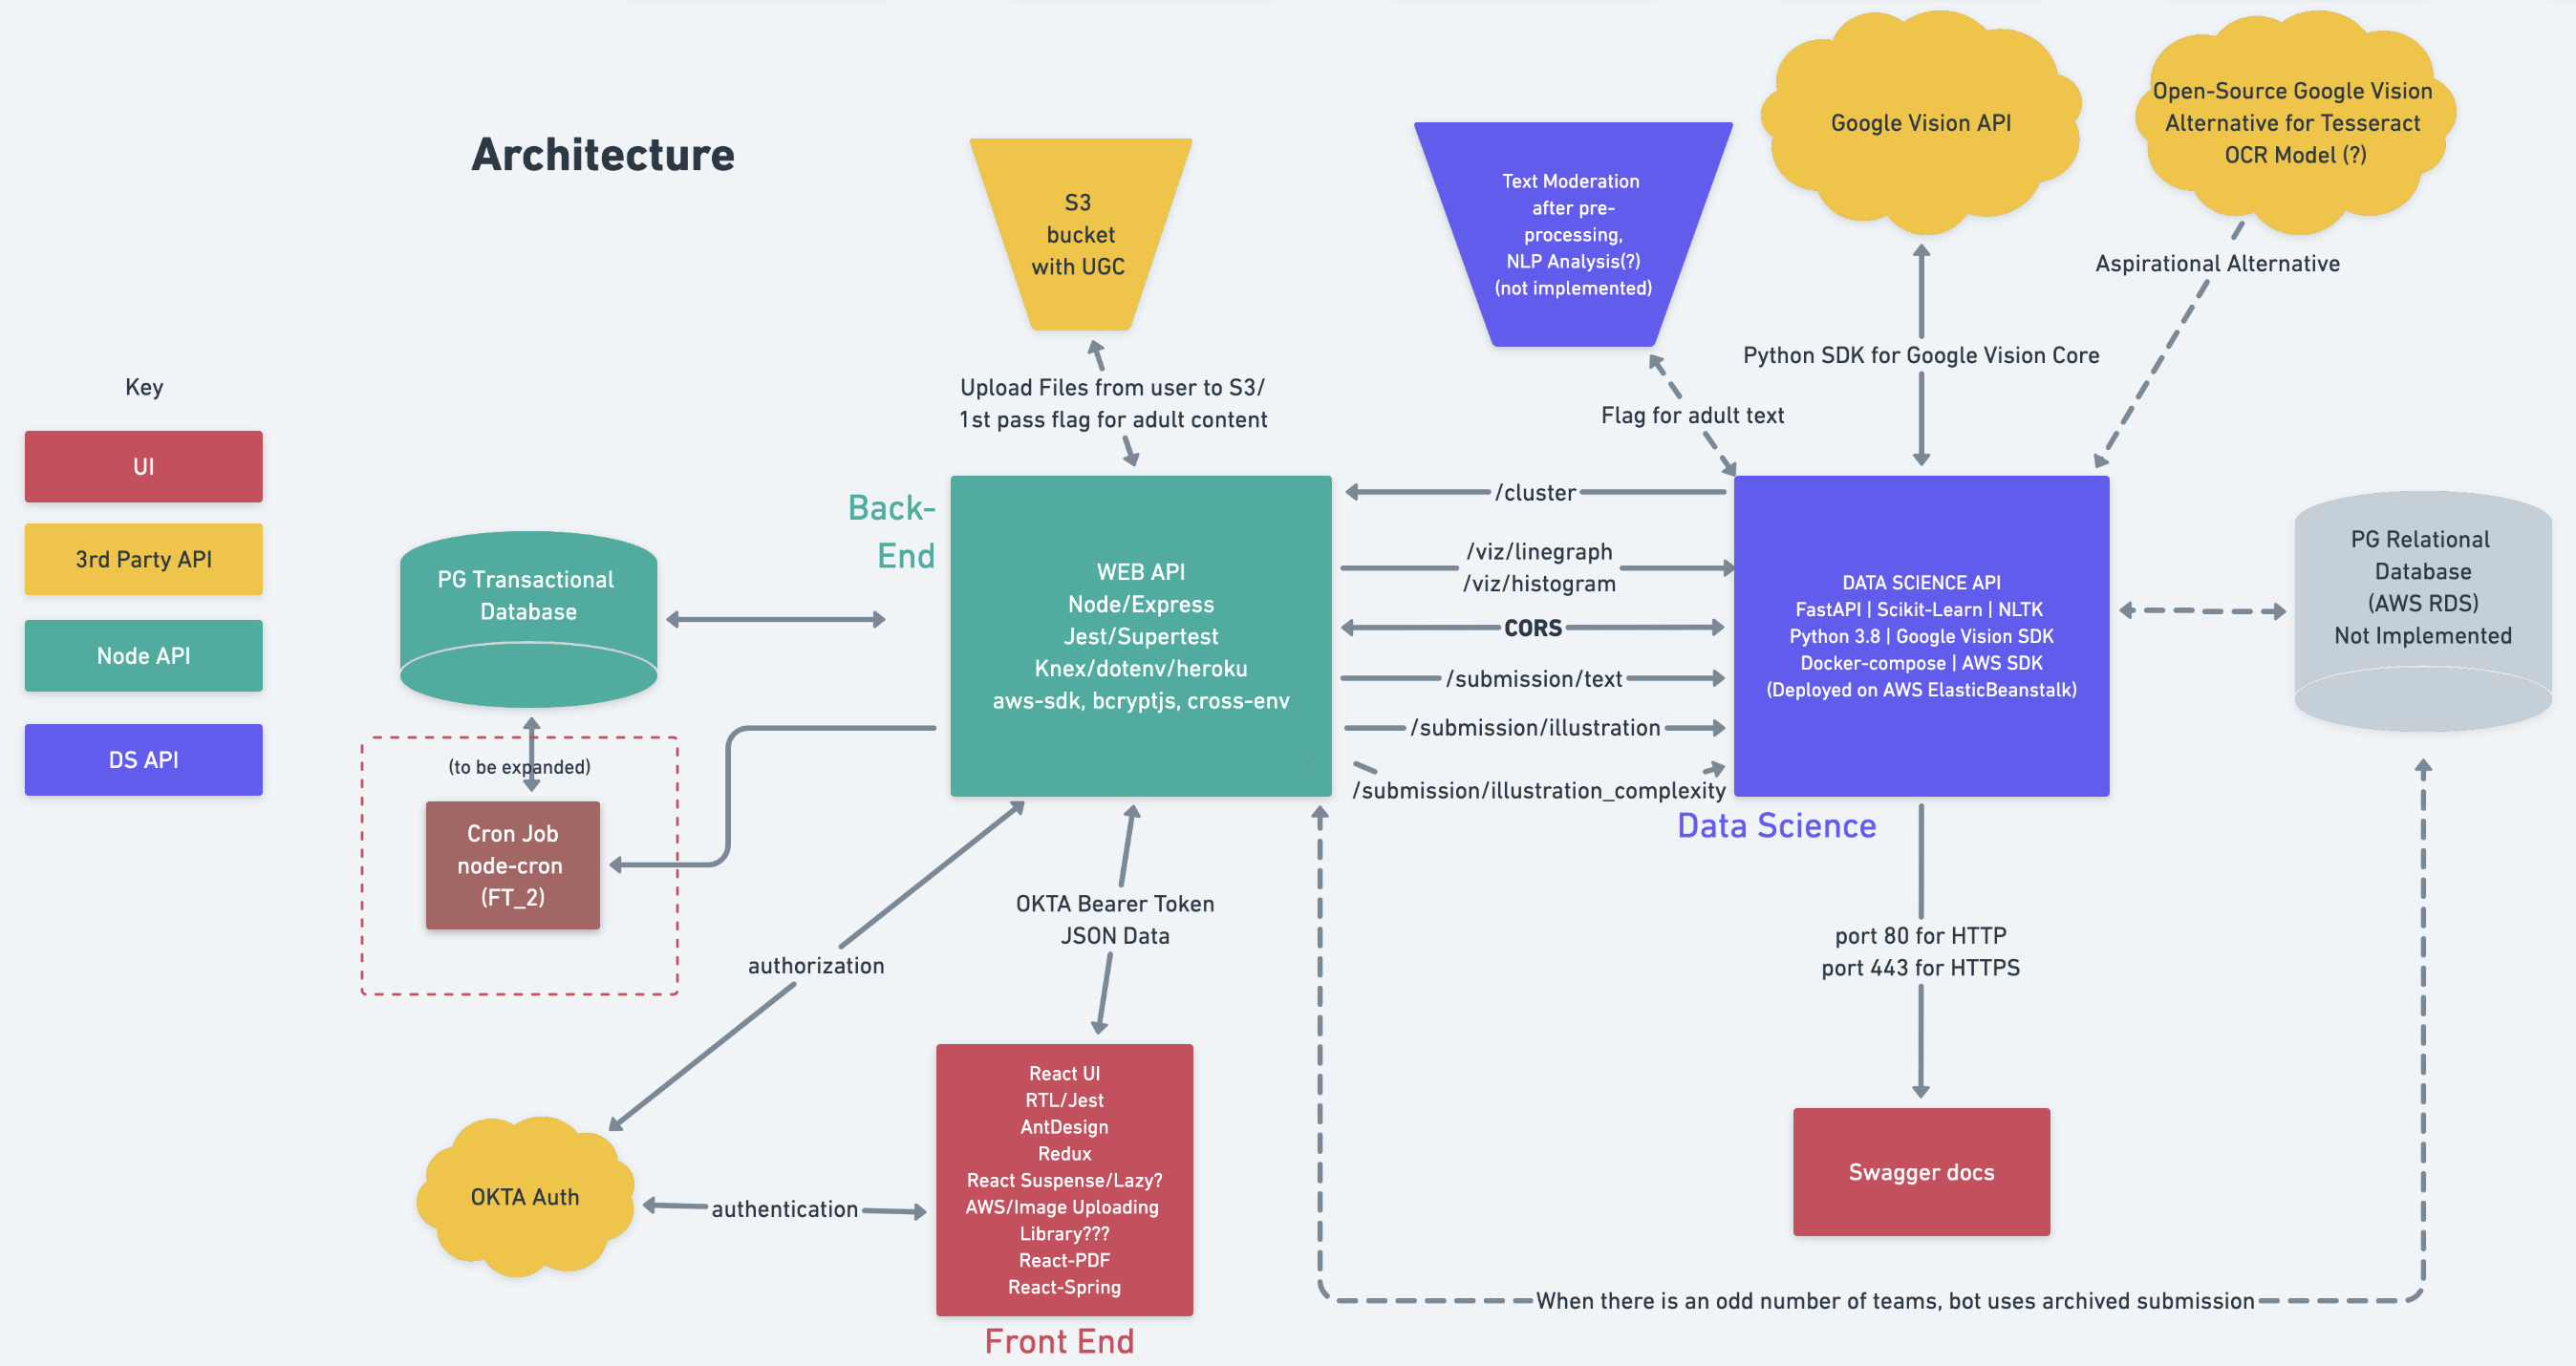 Story Squad’s working architecture map at the end of week 1
One major barrier my fellow data scientists and I had to address was the extremely small amount of authentic training data (only 200 samples). I took over the task of generating synthetic training data to mimic children’s handwritten stories, since our team did not have enough time to source authentic kids’ fanworks.
Fake it
Two hundred samples is not enough to properly train a machine learning model, period.
Ideally, future teams would put together a plan to access more handwritten and hand-drawn fanworks from kids in 3rd to 5th grade, but in the absence of such a solution, fake data samples needed to be mocked up.
I sourced and altered a web-scraping script to scrape short stories, adjusting the script to select for “childish” traits such as maturity level, content, and low popularity (the latter as an imperfect proxy for quality). I also sourced, evaluated, and ultimately downloaded 54 different handwriting fonts to begin to represent the large range of variety and legibility of children’s handwriting.
Next, I wrote a function to generate any given number (“n”) of images with text on them, using the Pillow library, and randomized a variety of parameters, including text (“pencil”) darkness, image size, background color, whether the “paper” was lined or not, etc.
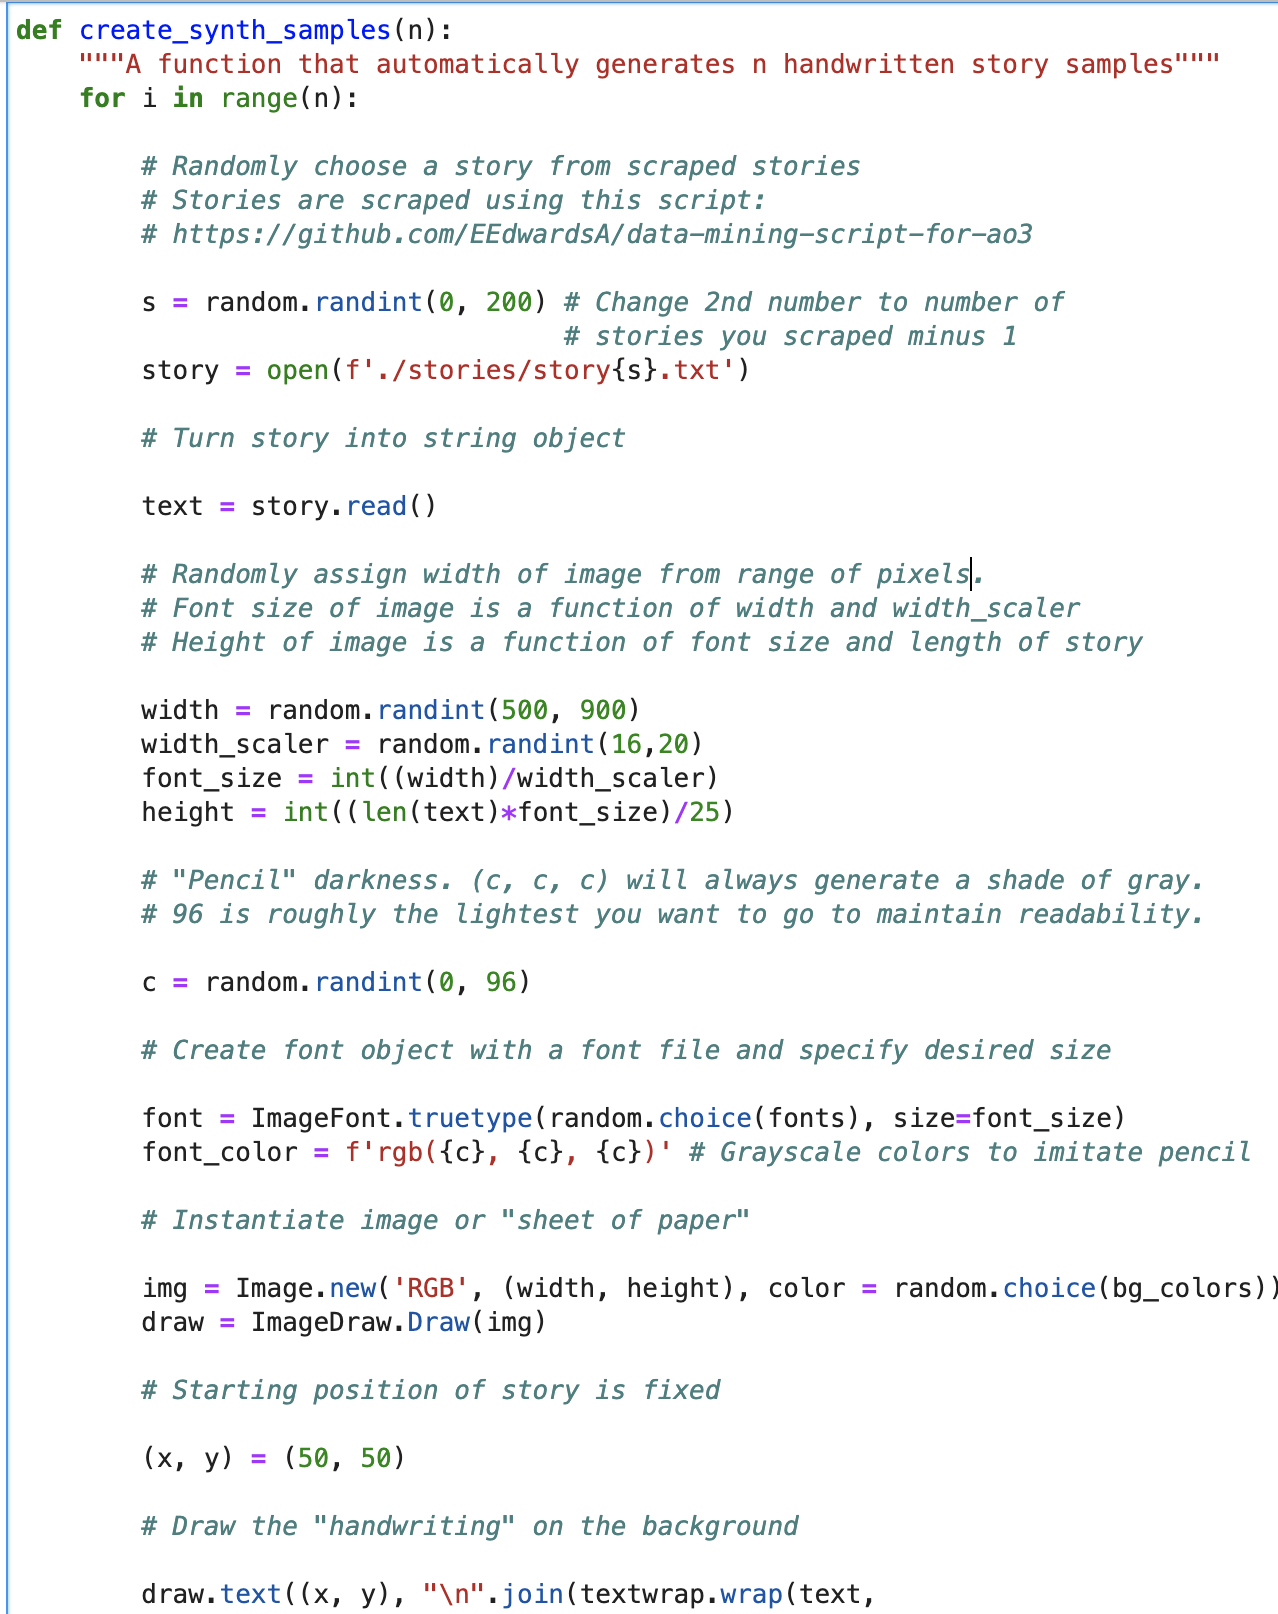 A screenshot of the beginning of the function. I wanted to comment it thoroughly to flatten the learning curve for the next cohort to work on Story Squad.
Make it
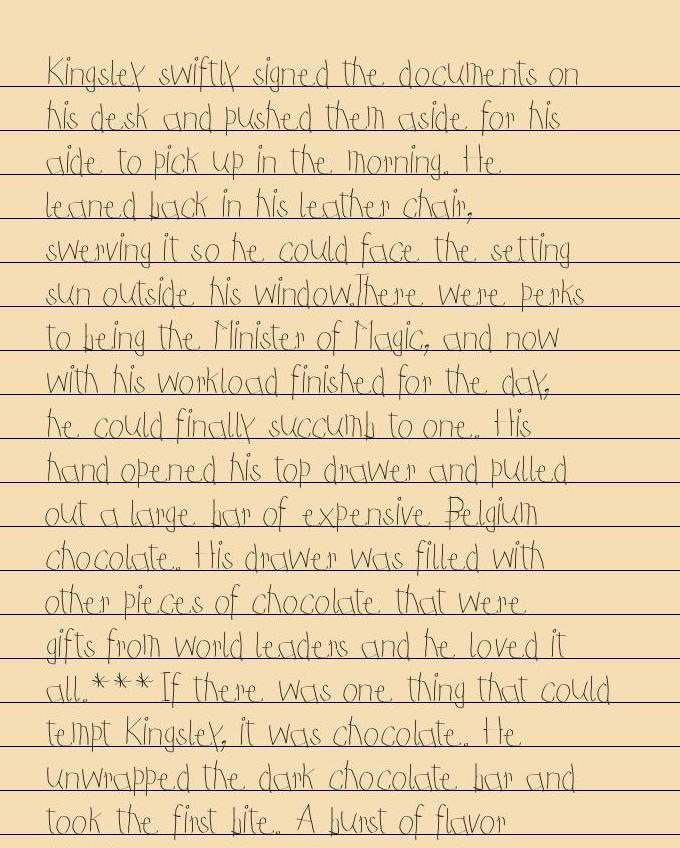
The top half of an example synthetic story image, generated using my function
Current state of the code
The main thing I’ve accomplished is that before I touched this project, there was no synthetic training data and no way to generate synthetic training data. The next team can now generate arbitrarily many synthetic data samples.
 n could be 100, or 500, or 10,000…
However…quantity is not a replacement for quality. There are many things about my function that could be improved upon, and which I have painstakingly documented for the next data scientist whose goal it will be to improve this function:
Bugs that still need to be fixed in the synthetic training data generation function:
- Writing often runs off the right or bottom of the page
- Line spacing matches height of font much less frequently than it should
Ideas for future teams to experiment with/iterate on to better mimic real data:
- Handwriting variation; no two letters look exactly the same. I have two ideas for mimicking this:
- Some fonts have more than one symbol per character. This can be activated by passing in “features=’aalt’” as an argument; the Libraqm library is compatible with Pillow and should enable this functionality.
- The function could also be refactored to use multiple fonts per string, e.g. with a for loop.
- Lighting variation across pages, e.g. dark in one corner with a gradient of light across the rest of the page.
- Eraser marks that make the background of one word/phrase/character much darker than the overall shade of the sheet of paper.
- Variation in darkness of “pencil” (text color) across the page.
- Variation in thickness of text (e.g. as if a pencil is getting blunter as the child writes).
- The “starting point” (i.e. where on the page a person begins writing) will not be uniform in real data.
- Line spacing, for example, writing that skips every other line.
- Tilted pages (i.e. rotate some images a few degrees left or right).
- Skewed pages. In many of the authentic samples, the camera is not perfectly parallel to the page, so the left edge of the paper is longer than the right edge or vice versa.
- Randomize how close to the “lined paper” the words are.
- The intuition here is that some people write sentences such that the bottom of the text perfectly brushes up with the line below, others write sentences more vertically centered between the upper and lower lines, etc.
My favorite aspect of this project was that it gave me the opportunity to apply my technical skills to a real-world project and experience teamwork on a whole new level.
At the beginning of Labs, we were split into two teams, an A team and a B team, both of which had all the same objectives. B team lost one of our four members halfway through, and A team lost three of their four members. The four remaining data scientists on both teams decided we were stronger together than we were separate, and could better deliver value to our stakeholders if we worked as one unit. I have an immense amount of gratitude and respect for Jeannine Proctor, Victoria Debebe, and James Hagerman, who each contributed greatly to solving different aspects of Story Squad’s data science challenges, and I hope that the members of the next team I’m on share similar levels of commitment, passion, and kindness.